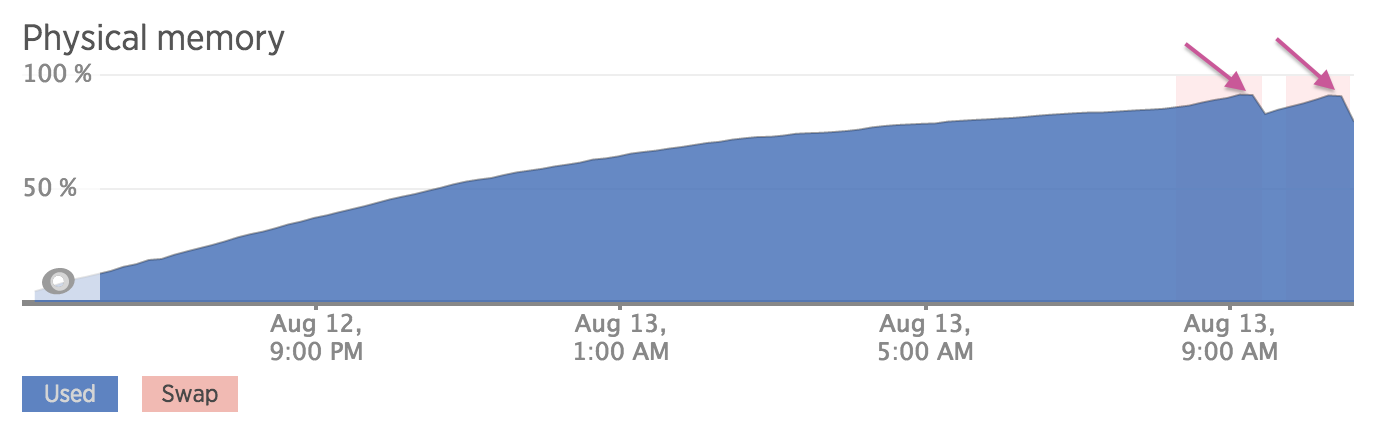
I received a "high memory usage" alert. Already panicking, I logged into New Relic and saw this terrifying graph:

That's a graph of memory usage, starting from when the server was created. For the uninitiated, when memory usage grows and grows and grows like that, chances are very, very high that you've got a nasty memory leak on your hands. Eventually, your server is going to run out of memory, and the system will start killing processes to recover some memory and keep running -- or just crash and burn.
The funny thing about this particular server is that I had already identified that this server was leaking resources, and I thought I'd fixed it.
So, I started to investigate.
Running free -m confirmed that nearly all the memory was in use. But top (sorted by MEM%) indicated that none of the server processes were using much memory. Huh?
After some time on Google and Server Fault, I ran slabtop and saw that nearly all server memory was being cached by the kernel for something called dentry. This server has 16GB of RAM -- I'm no expert, but I'm pretty sure it does not need 14GB of cached directory entries. I know I can free this RAM, and with some more help from Google I find the magic incantation is:
echo 2 > /proc/sys/vm/drop_cachesAfter 5 terrifying seconds during which the server seemed completely locked up, the memory had been freed! But apparently, something about the way this server was acting was causing the kernel to keep all these directory entries cached. In other words, this was probably going to keep happening. I didn't want to have to create a cron job to manually clear the cache every 4 hours, but I wasn't above it.
More reading told me that maybe I was worried about nothing. Looking closely at the peaks of that graph, I saw that the kernel was freeing up memory.
So maybe I was worried about nothing! Still, I didn't want New Relic alarms going off all the time. And what if the server needs memory more quickly than the kernel can free it? It seemed like something I shouldn't have to worry about.
Yet more Google-noodling, and I found that you can indeed tell the kernel how aggressively to clear the caches. (That latter post captured practically my thoughts exactly, and seemed to trace my experience tracking down this issue to a tee.)
So, after some tweaking, I settled on setting the following sysctl configuration in /etc/sysctl.conf (edit the file, then load it with sysctl -p):
vm.vfs_cache_pressure=100000
vm.overcommit_ratio=2
vm.dirty_background_ratio=5
vm.dirty_ratio=20
It seemed like the higher I set the vm.vfs_cache_pressure, the earlier (lower memory usage) it would free up the cache.
Here's a sweet graph showing three states:
- [A] untweaked
- [B] manually clearing the cache with
echo 2 > /proc/sys/vm/drop_caches - [C] memory usage using the tweaked sysctl configuration
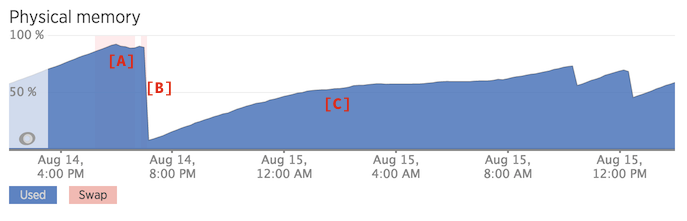
Those saw teeth on the right? That's the kernel freeing memory. Just like it was doing before, but more aggressively. This is a "memory leak" I can live with.